Knowing your customer is critical to the success of your online store. By having a clearly defined Ideal Customer Avatar you will be able to create and target messaging that aligns with them, creates connection and gets them to buy from you. Once you start making sales it’s really important to have an in-depth understanding of who your high-value customers are so you can find more of them!
Here are 4 really powerful insights into your audience you can get from Google Analytics.
Traffic & Conversions by Age
By going to Audience > Demographics > Age you will be able to see the breakdown of the revenue generated by each age bracket.
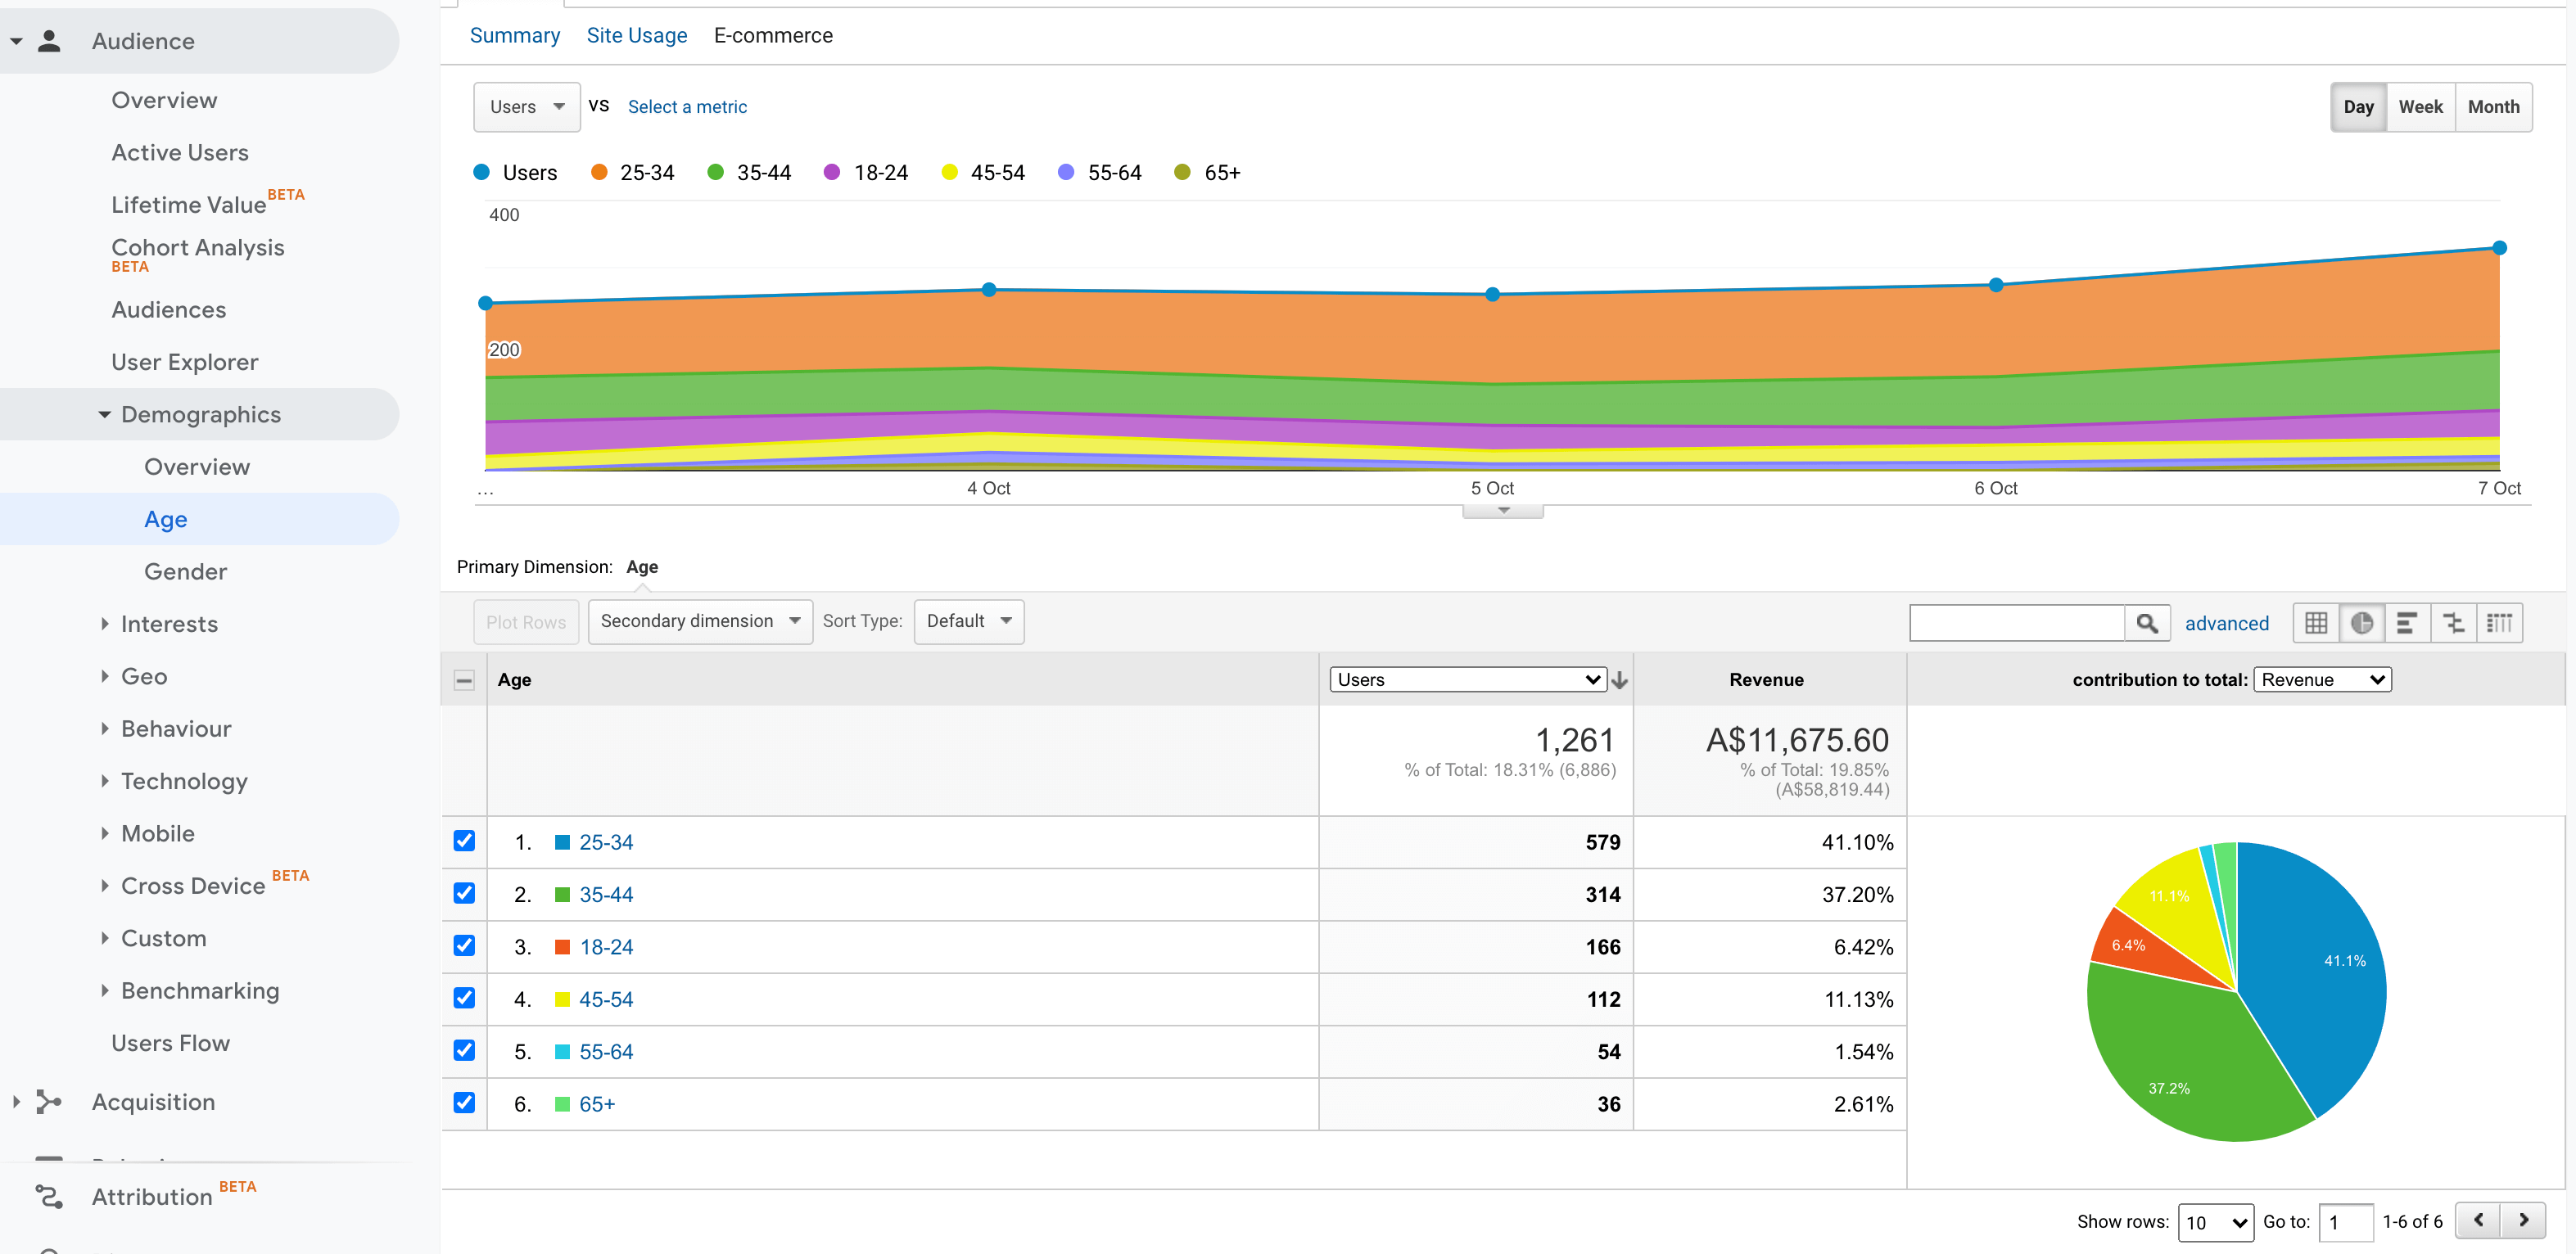
If you select the table view you can get a detailed view of the sessions, bounce rate, pages/session, average session duration, transactions, revenue and the conversion rate.
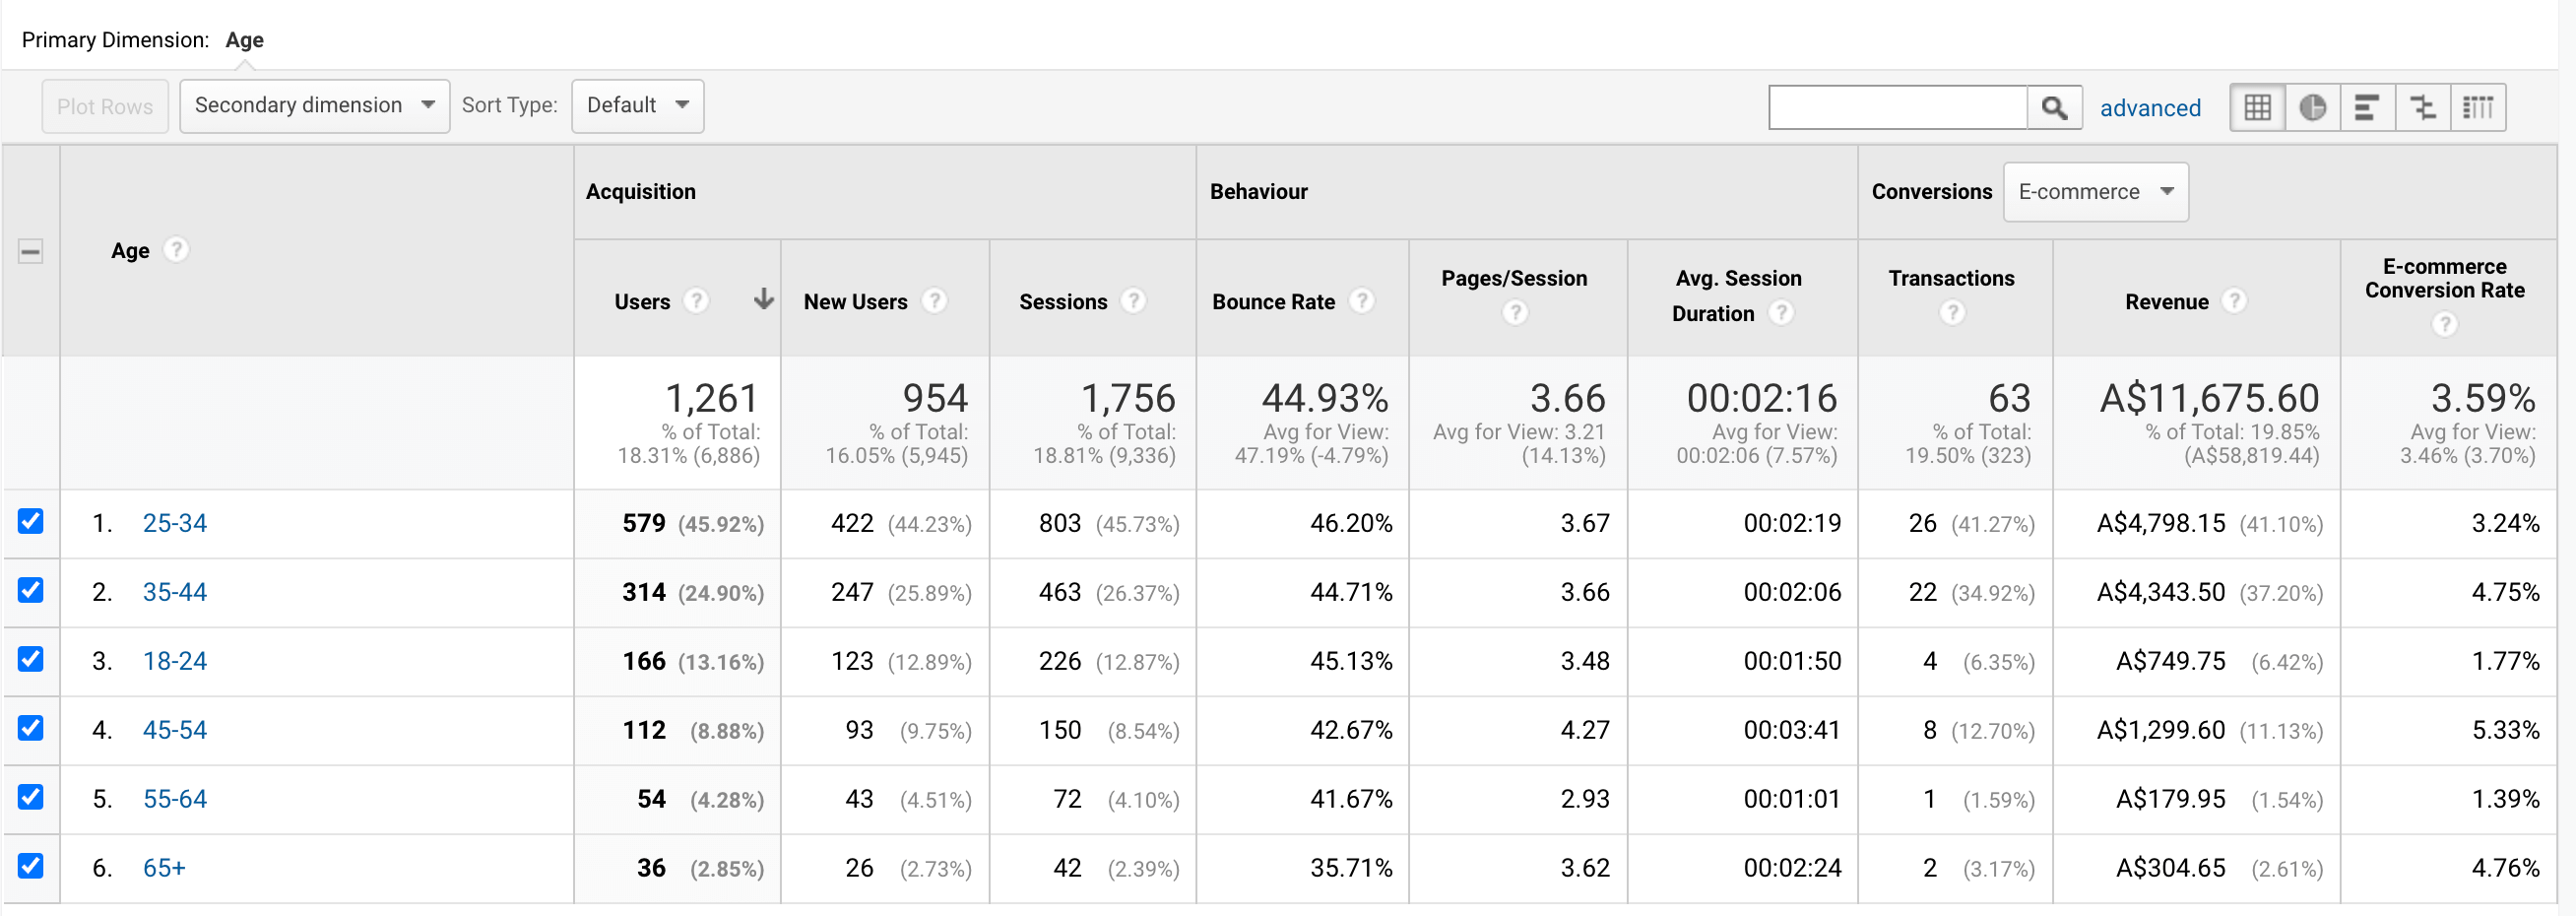
Don’t be tempted to look at one success metric in isolation here. You want to look at revenue and conversion rate. If the conversion rate is really high in one age bracket, like the 65+ bracket above, you may be tempted to think that this is worth pursuing more. But if you then look at the other metrics such as revenue and sessions, you will see that there haven’t been many people in this age bracket come to your site. There isn’t enough data to draw a conclusion around this demographic yet, so test it, but keep a close eye on it. You might find that by driving more traffic to your site in this age bracket will lower your conversion rate.
Traffic & Conversions by Gender
In the same section under Audience > Demographics > Gender you can see a detailed view of the sessions, bounce rate, pages/session, average session duration, transactions, revenue and the conversion rate broken down by gender.

You can see here that although most of the revenue is coming from female purchasers, the males who do come to the site convert at 6.54%. This means that when they do visit the online store they have high purchase intent.
Traffic & Conversions by Location
By going to Audience > Geo > Location you can see a breakdown of sessions, bounce rate, pages/session, average session duration, transactions, revenue and the conversion rate by Country, City, Continent or subcontinent. Get curious about the traffic, revenue and conversion rate by city.
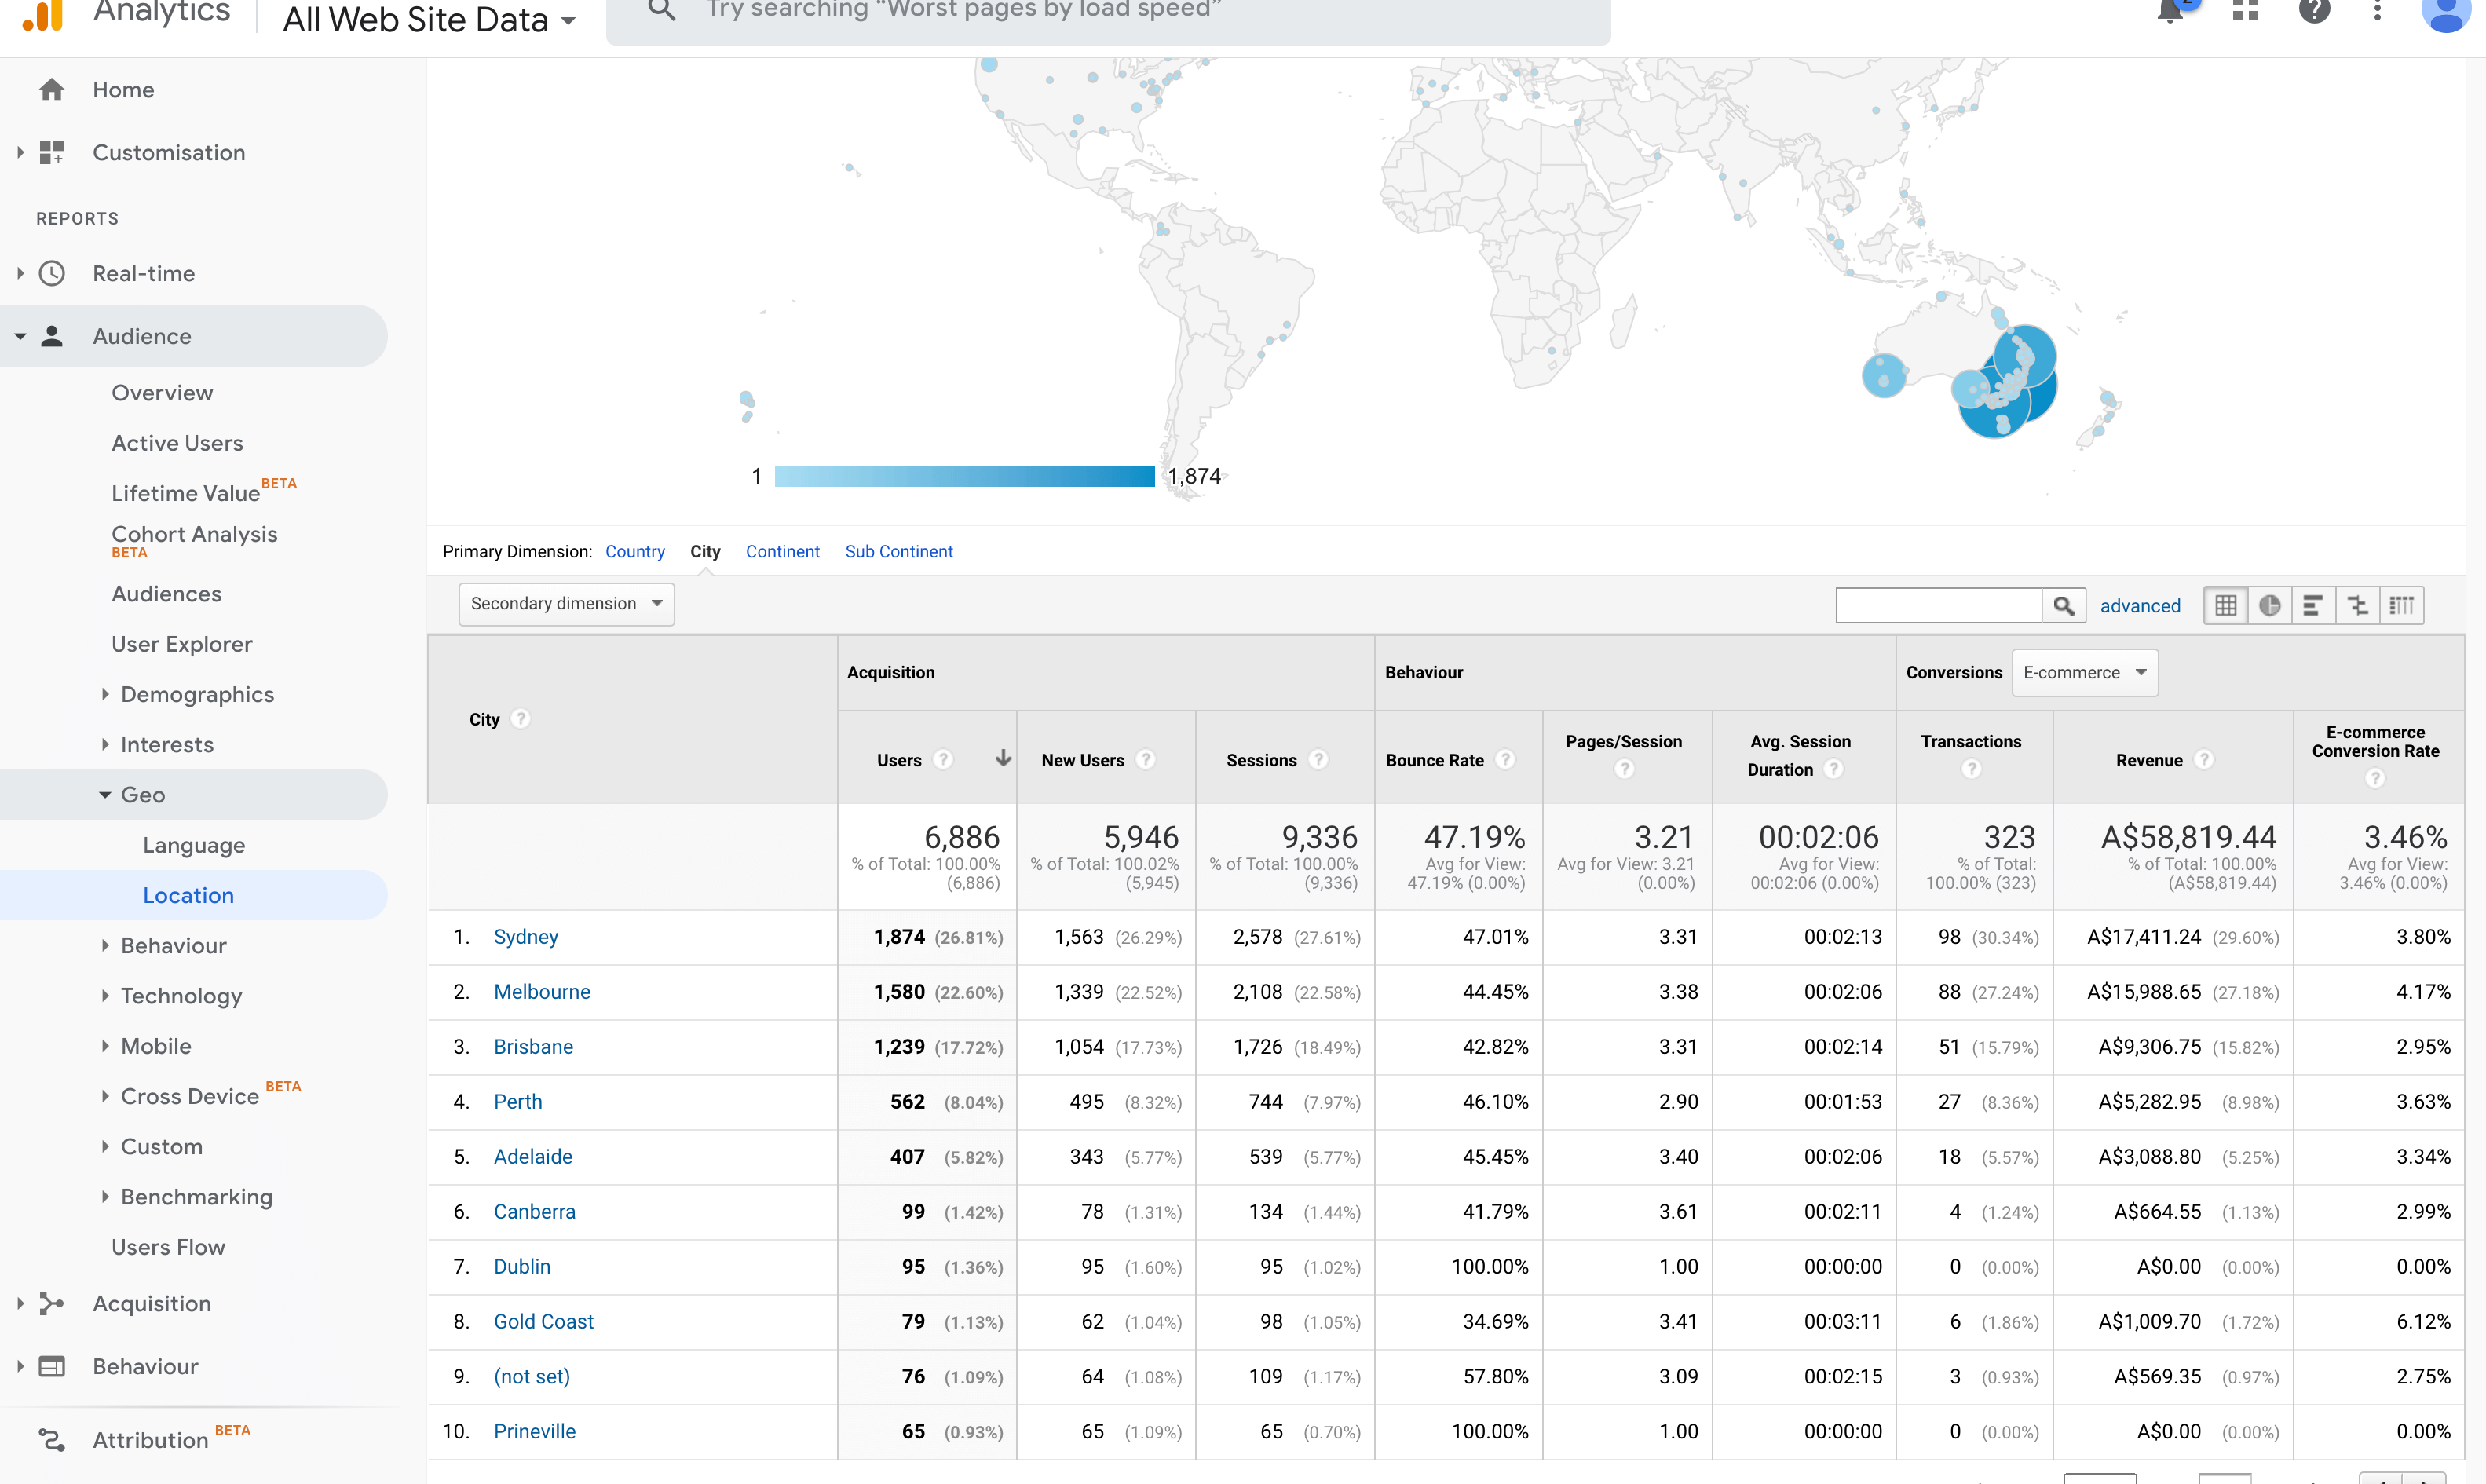
Get curious around what’s happening in each location and how you might be able to tailor specific messaging and campaigns to your best-resulting locations.
Traffic & Conversions by Interests
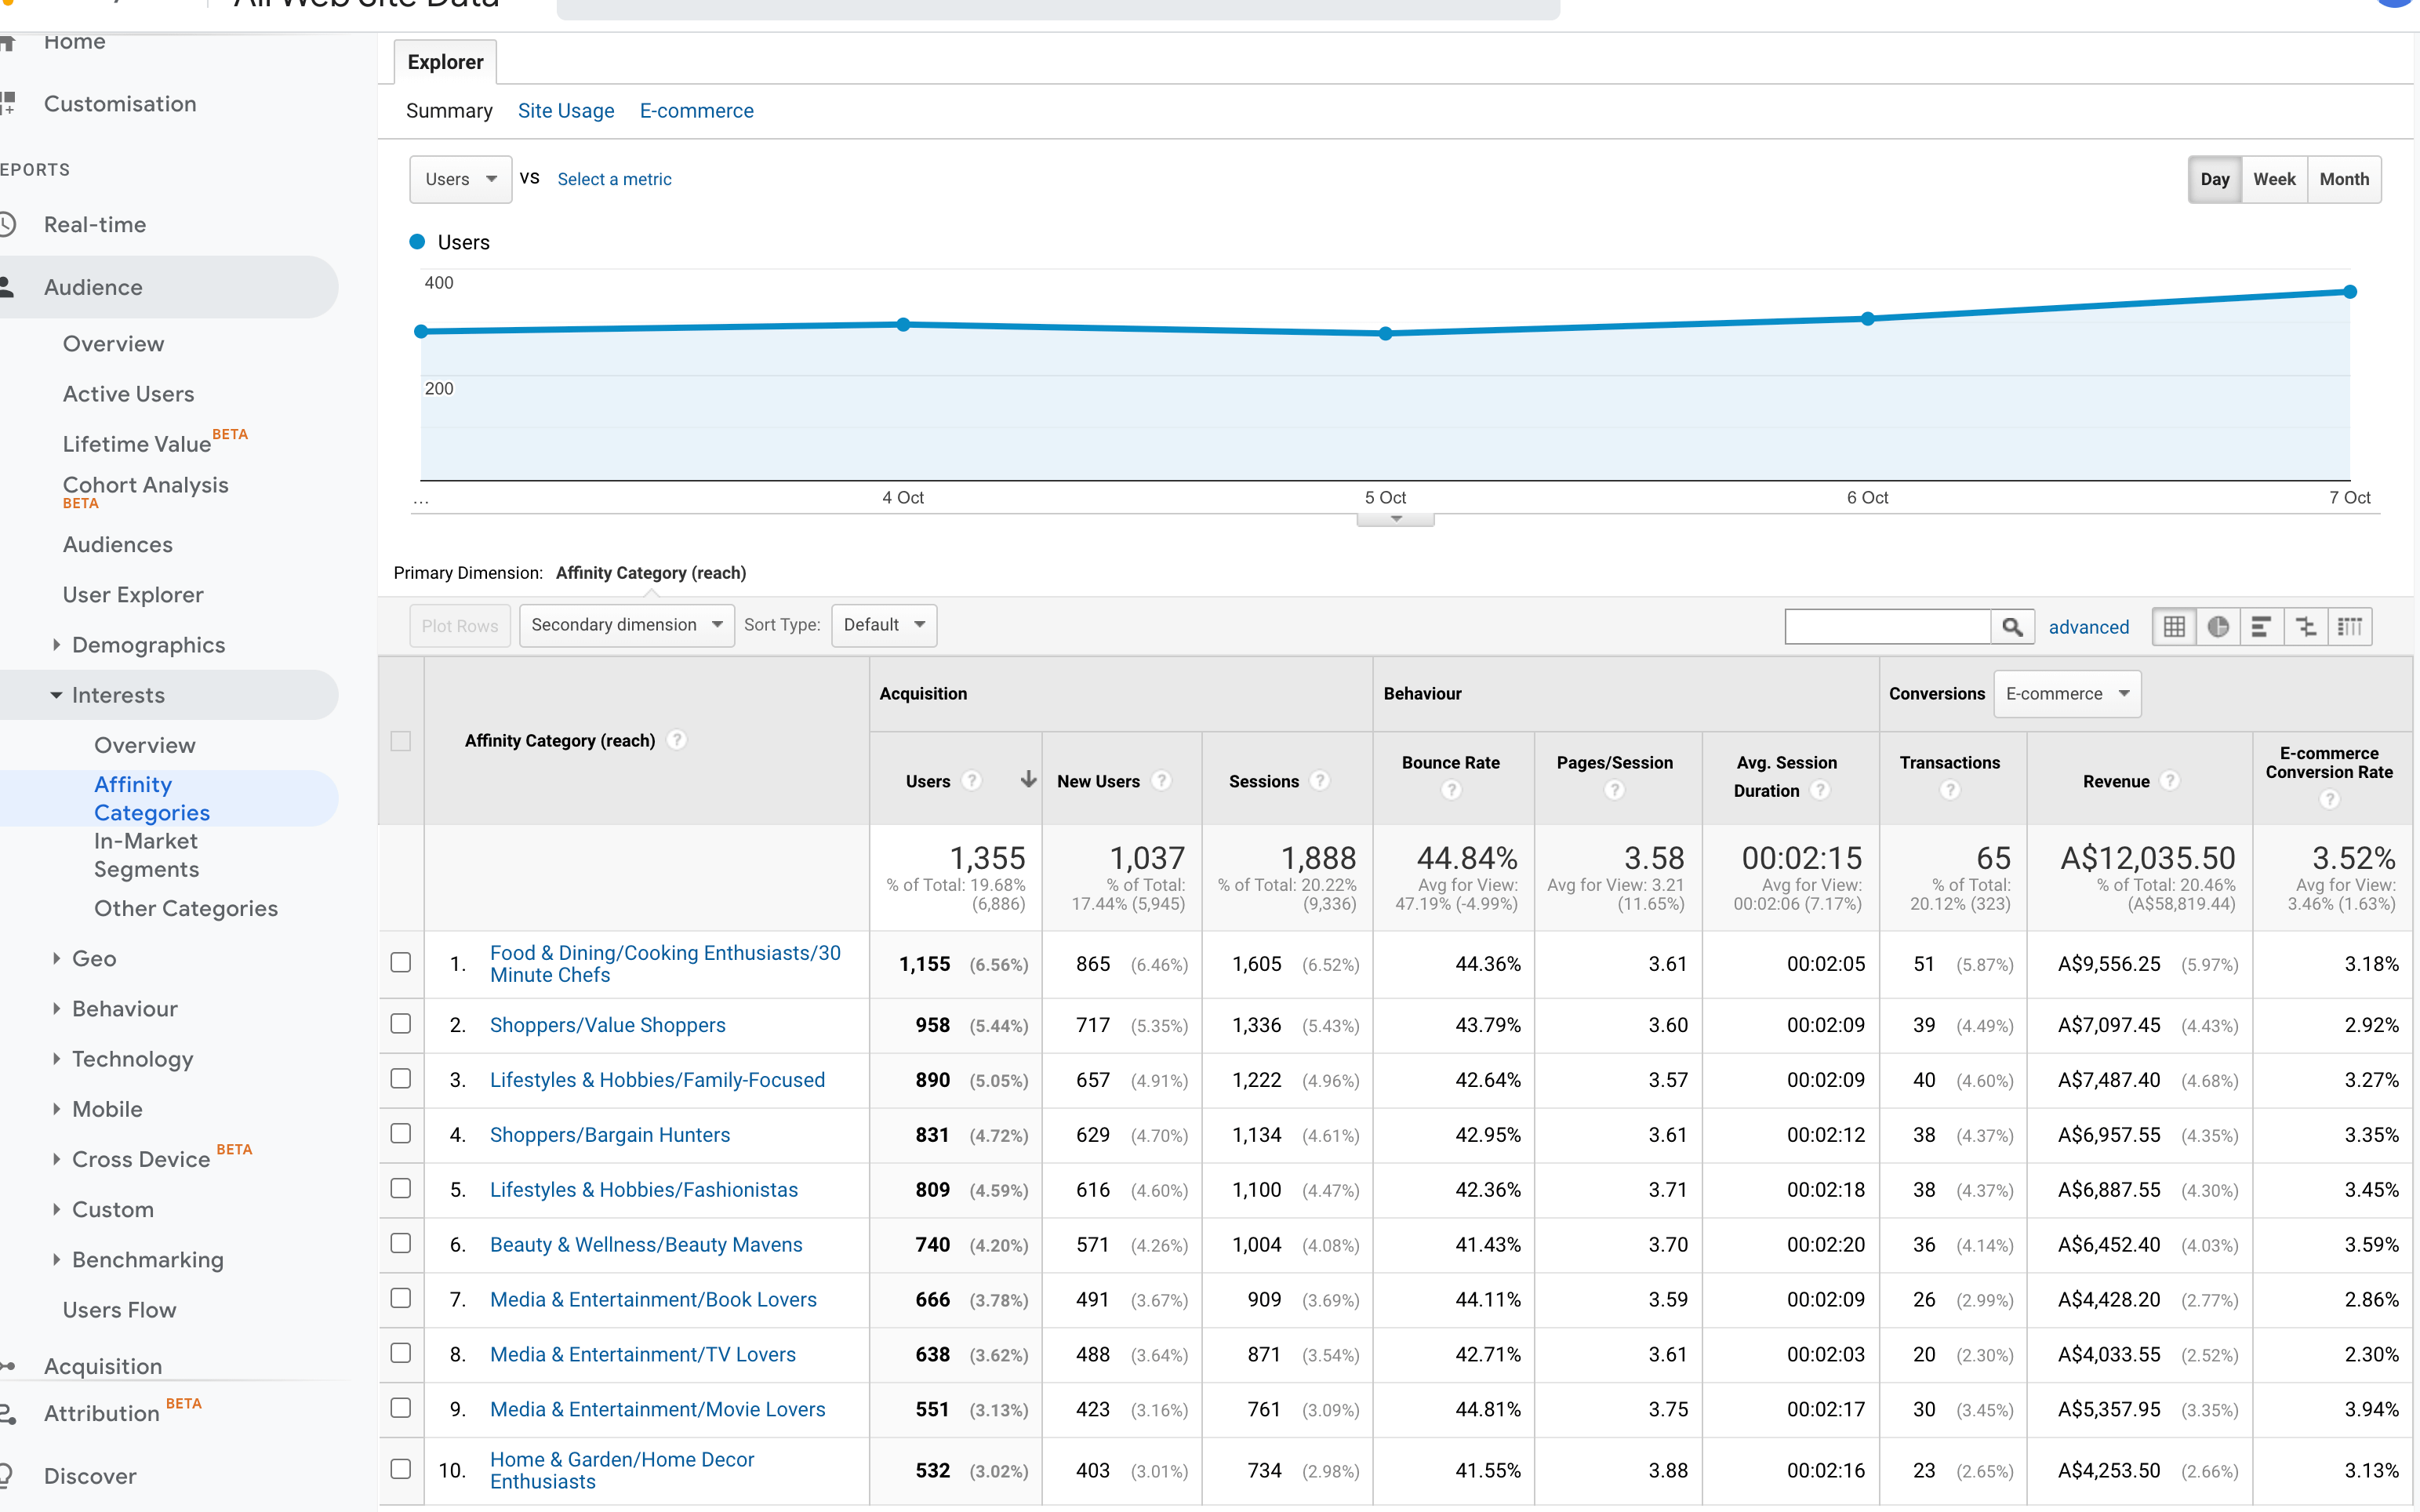
By going to Audience > Interests > Affinity Categories you can see what your potential customers are interested in. These are the people who are at the top of your funnel and are “colder” audience.
Affinity categories are used to reach potential customers, to make them aware of your brand or product. These are users higher in the purchase funnel, near the beginning of the process. These are the same Affinity categories that Google Ads uses. Learn more.
By going to Audience > Interests > In-Market Segments you can see what your potential customers who are ready to buy are interested in.
Users in these segments are more likely to be ready to purchase products or services in the specified category. These are users lower in the purchase funnel, near the end of the process. This is the same In-market designation that Google Ads uses. Learn more.
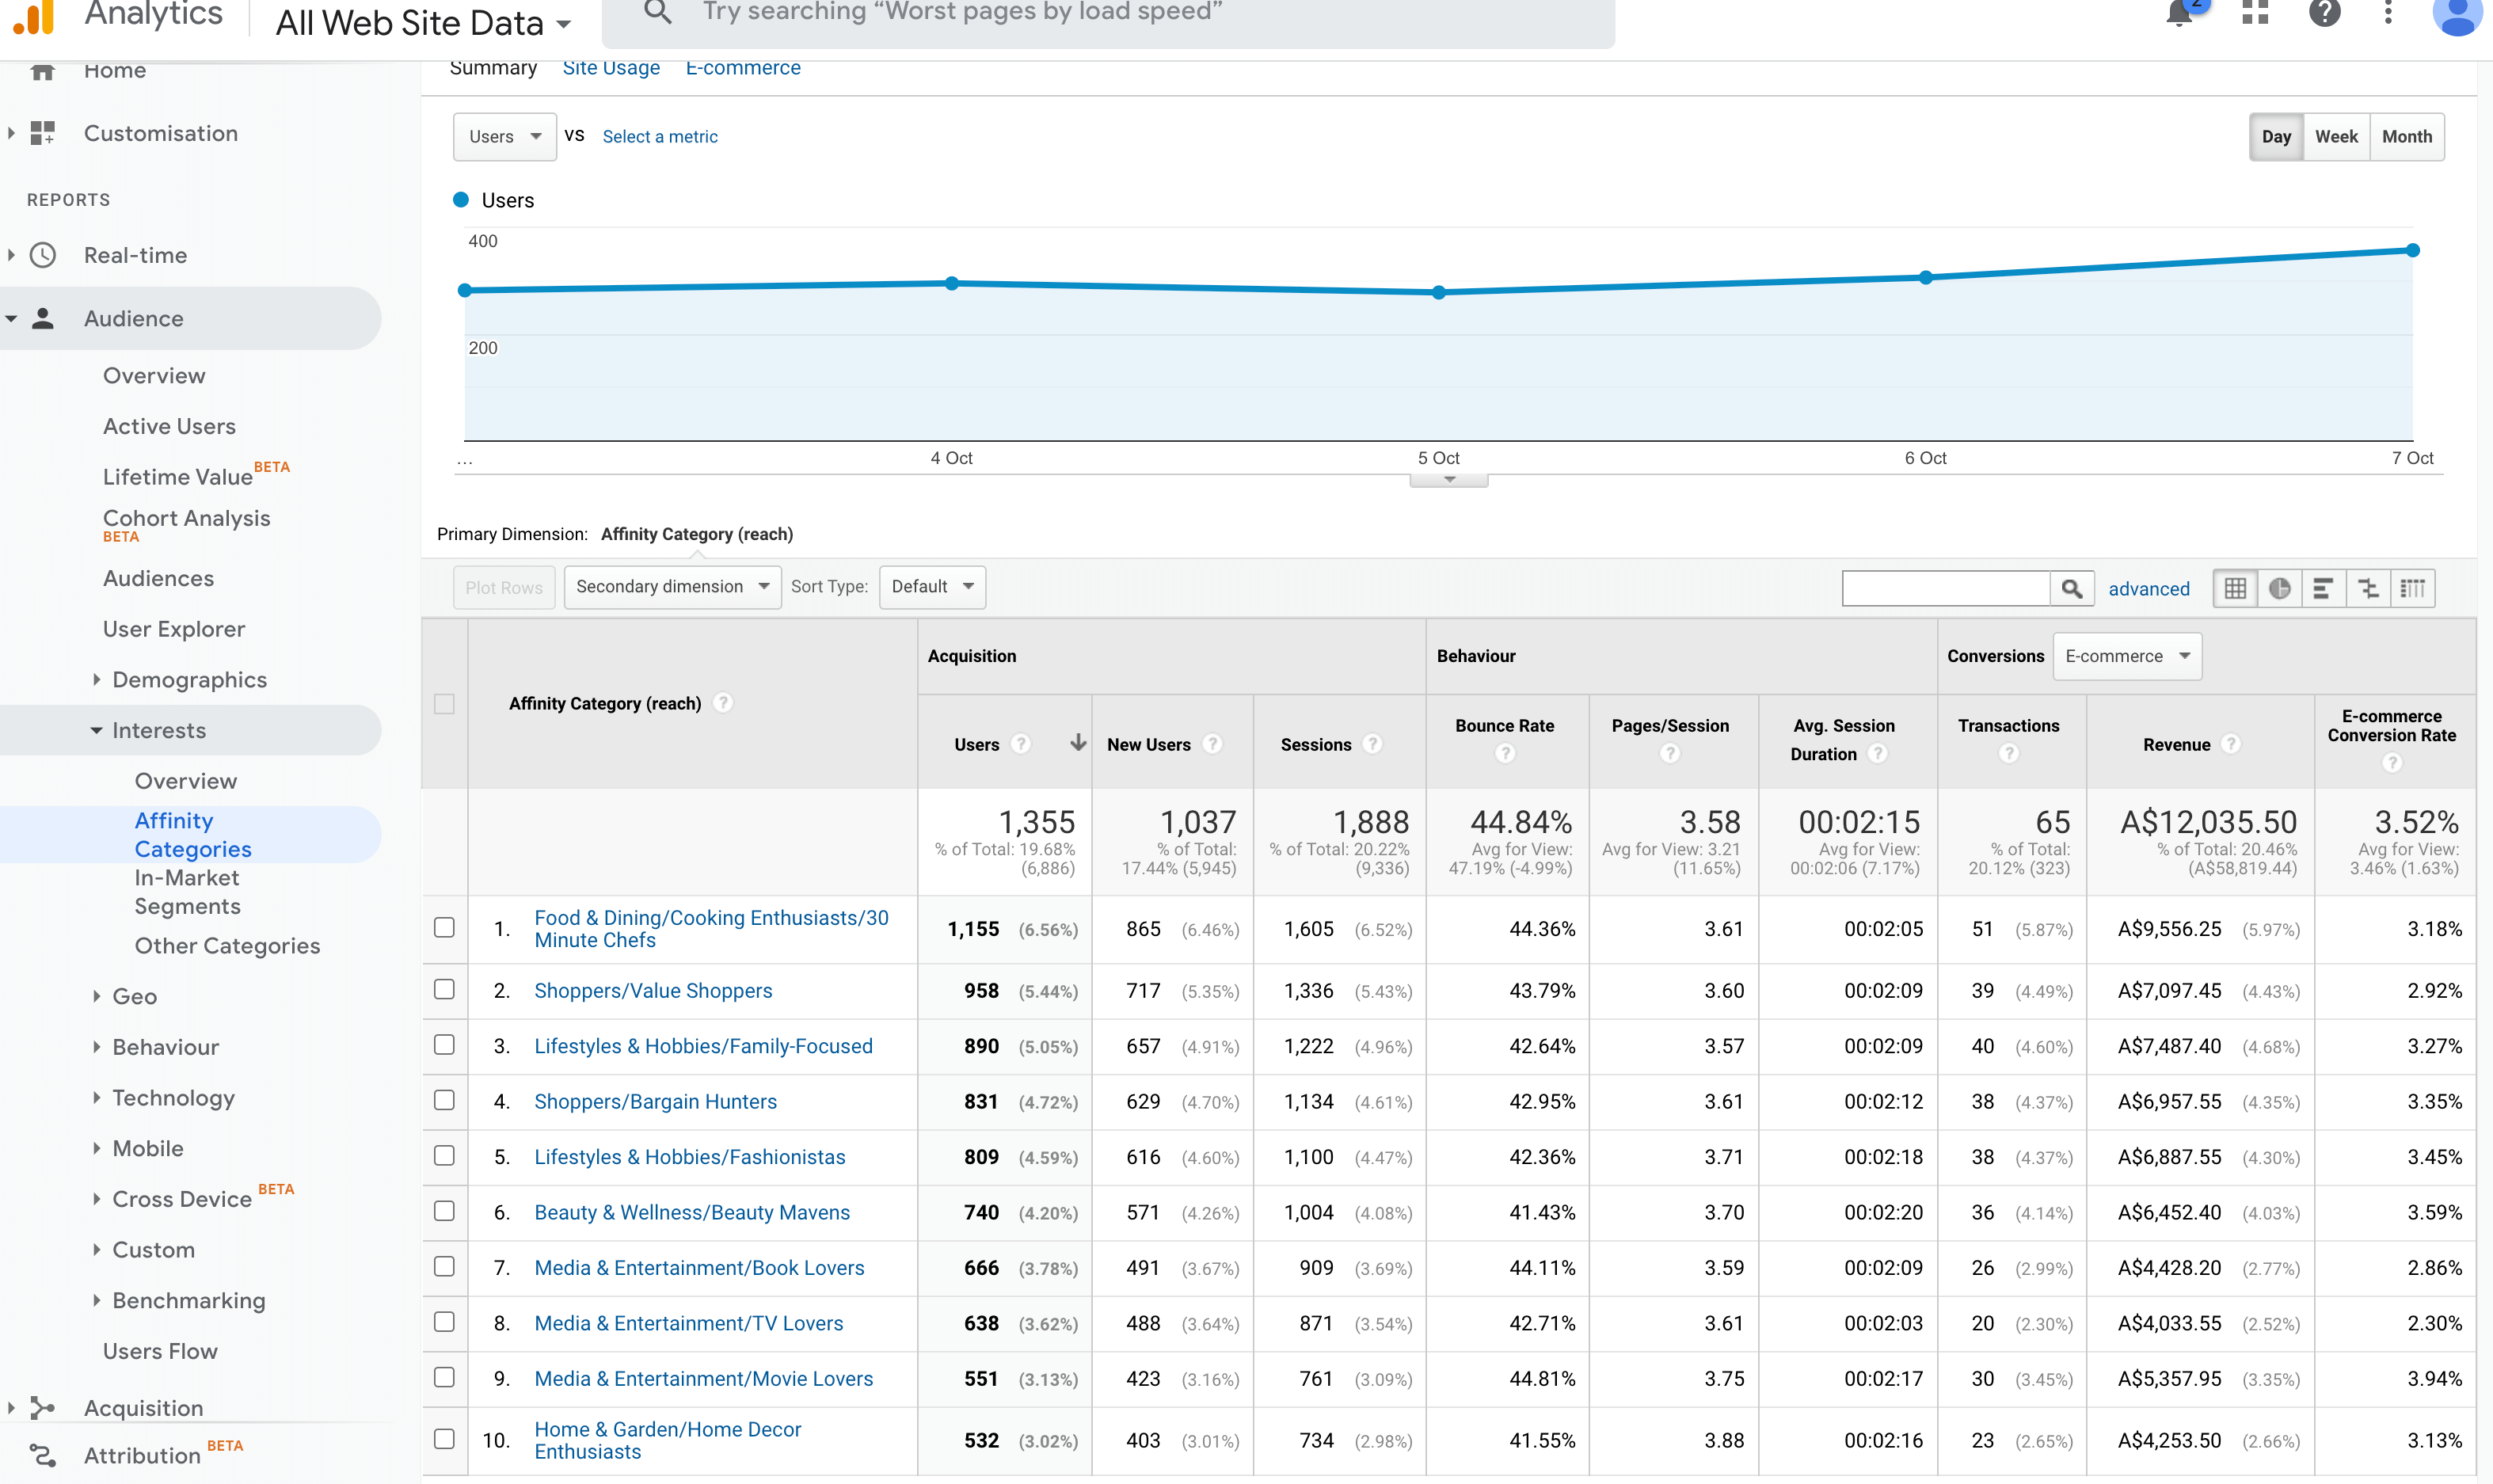
And by going to Audience > Interests > Other Categories you can what visitors to your site who don’t fit into affinity or in-market are interested in. Basically, everyone else who’s visiting your site.
These are more granular categories than Affinity or In-market, and let you identify users who are not in those other categories. These are the same category designations that Google Ads uses. Learn more.
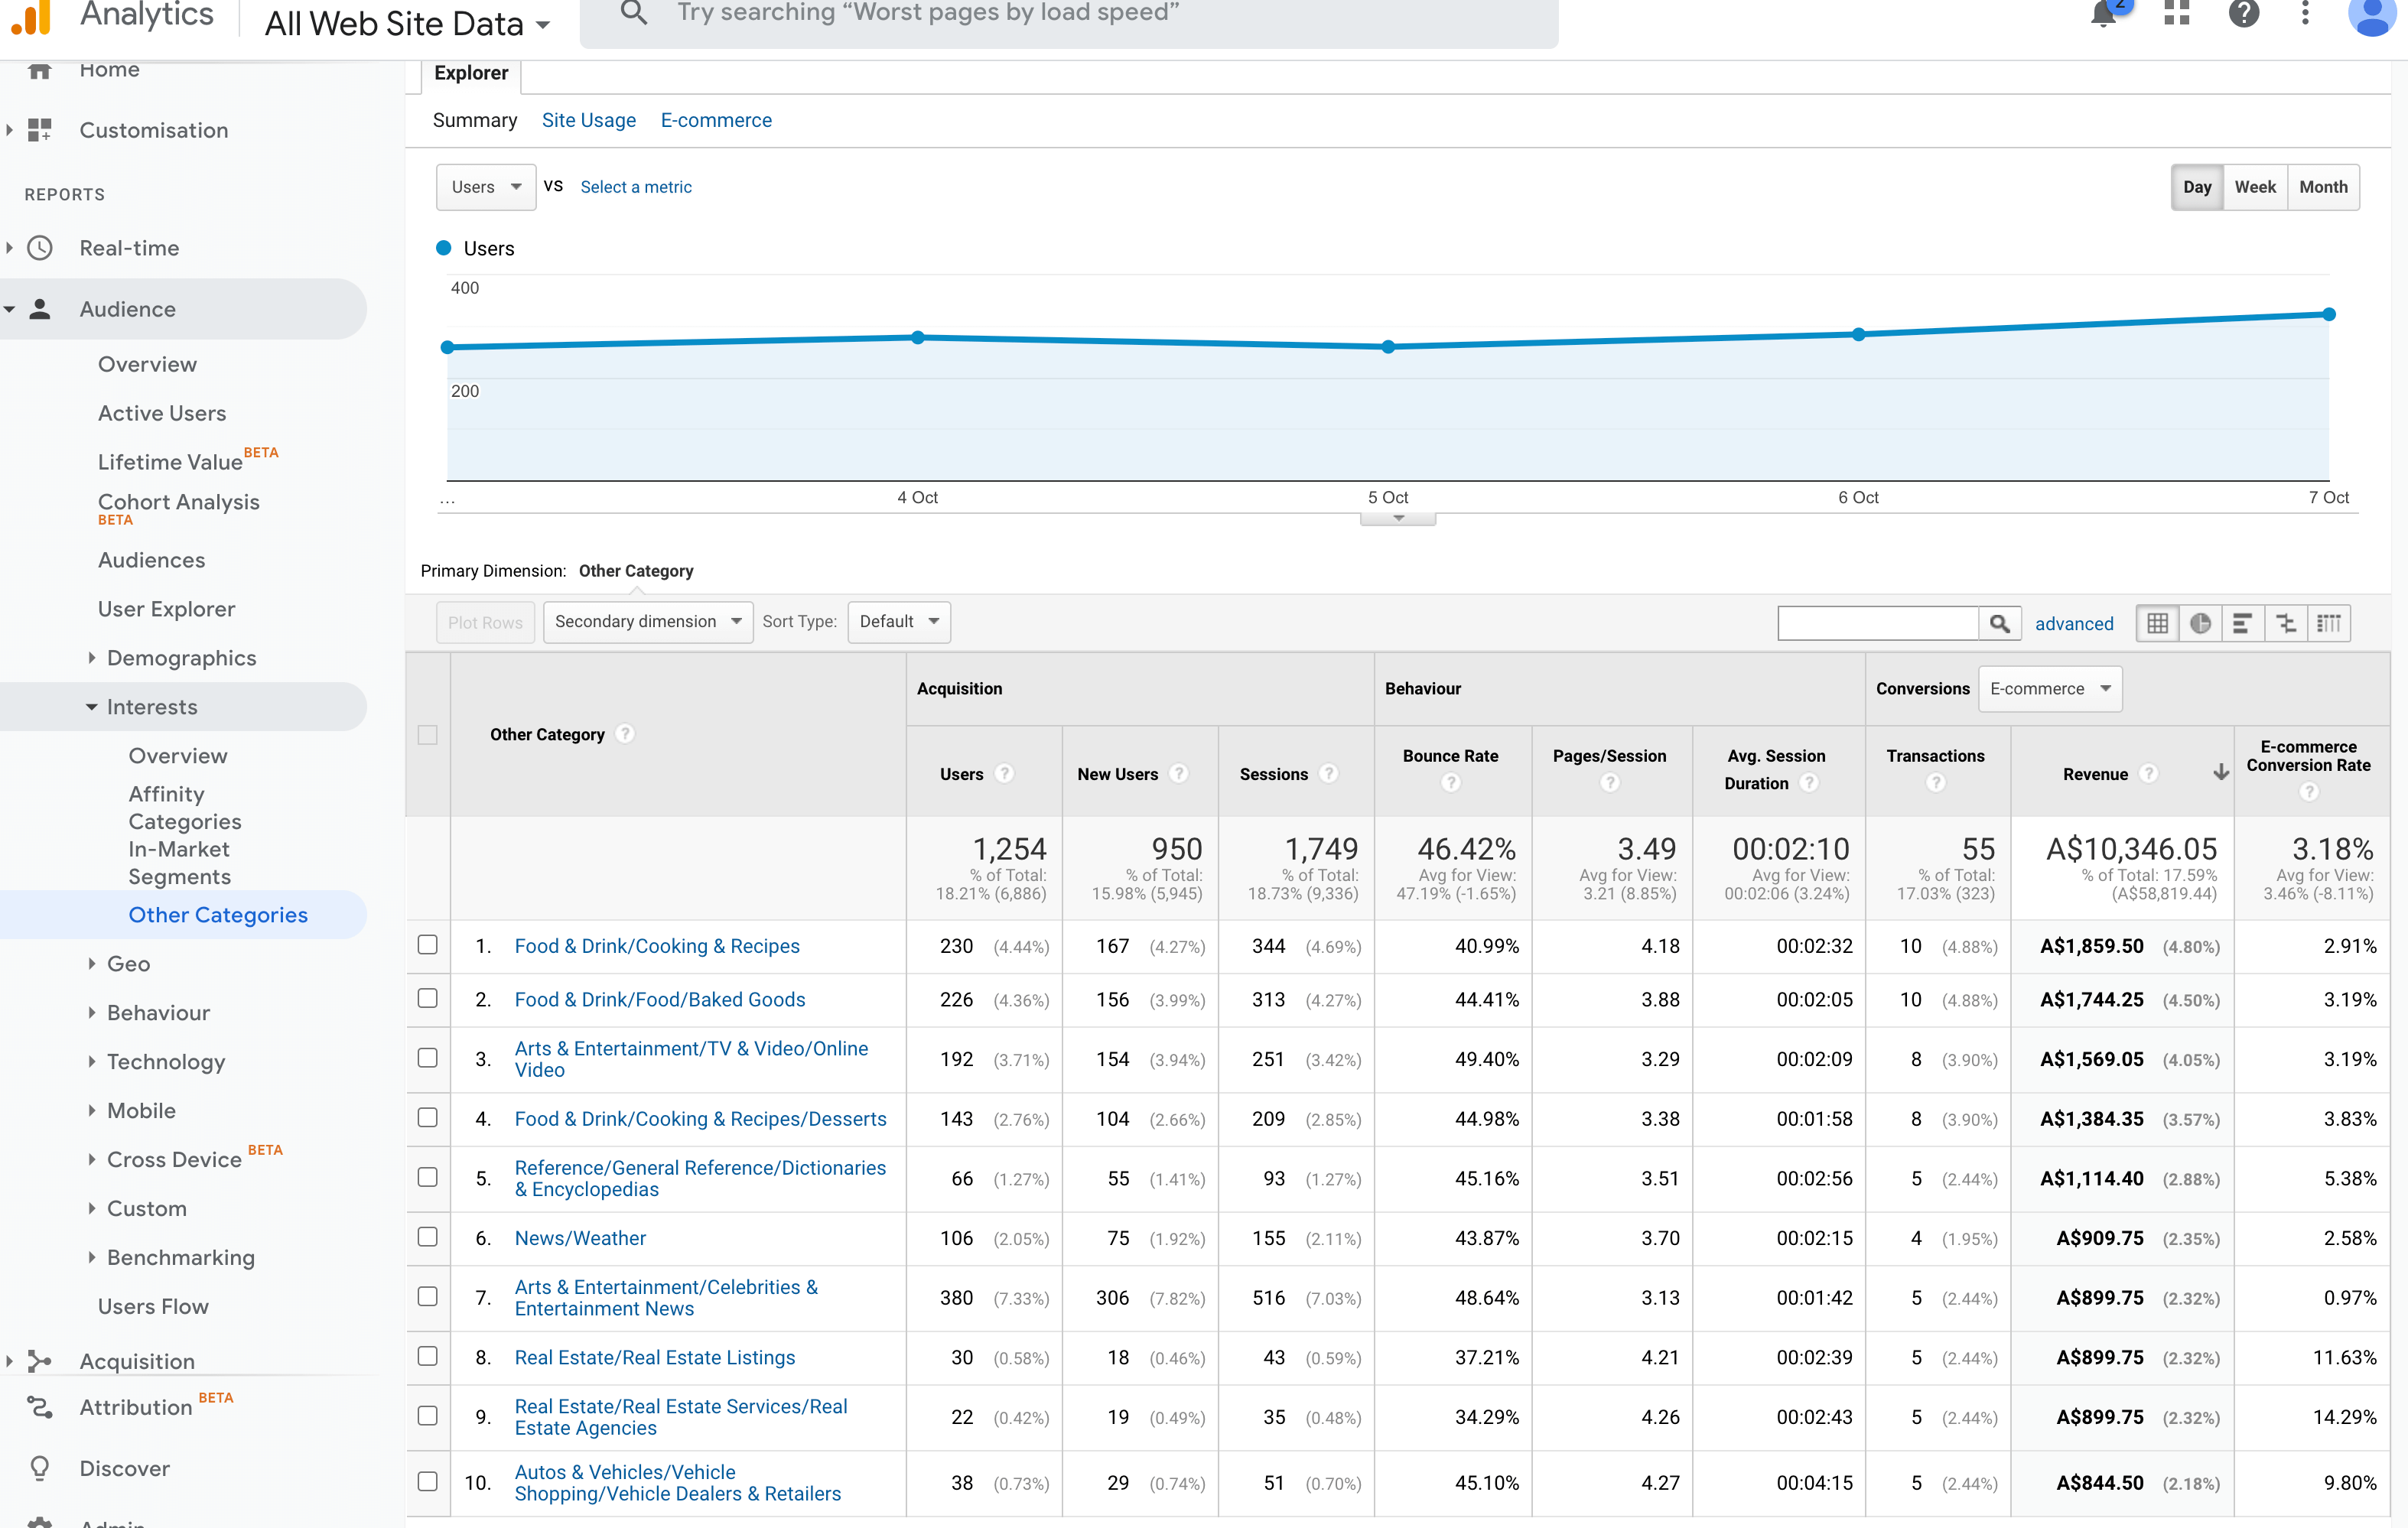
This is super interesting information because you can use these insights to influence your audience development when getting clear on your ideal customer avatar, you can also weave these insights into the implementation of your social media strategy, and you can test creating audiences to target with your Facebook Ads based on these insights.
How to turn on Demographics and Interest Reports
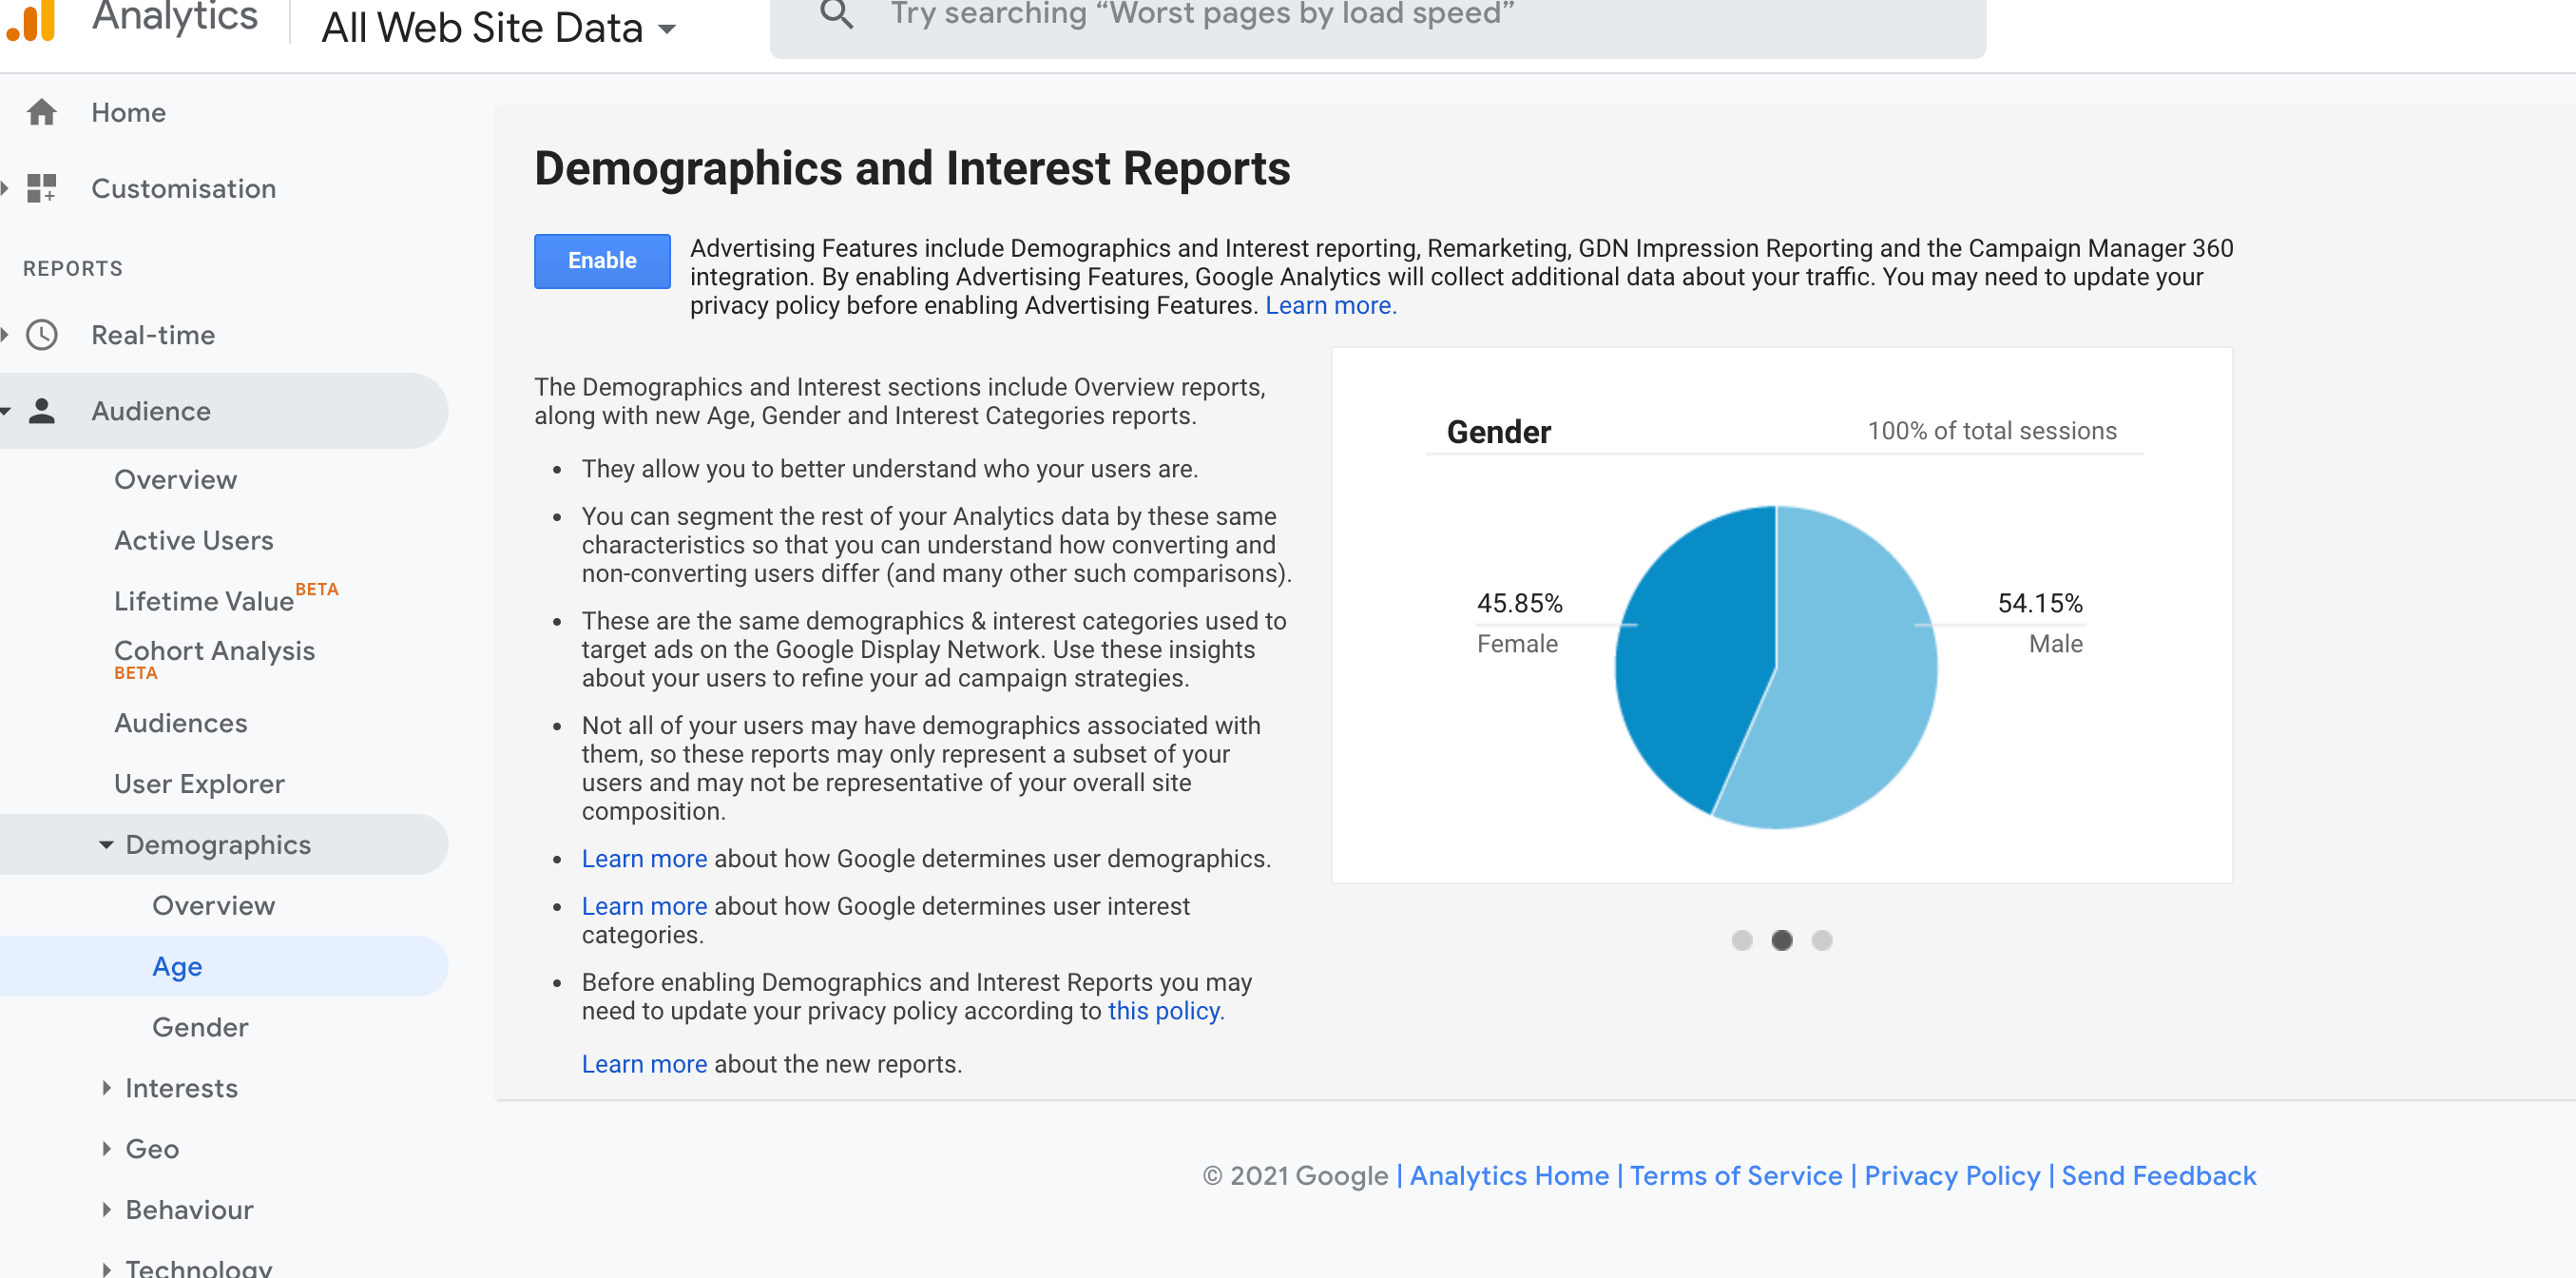
You need to go to your Google Analytics and click the blue Enable button.
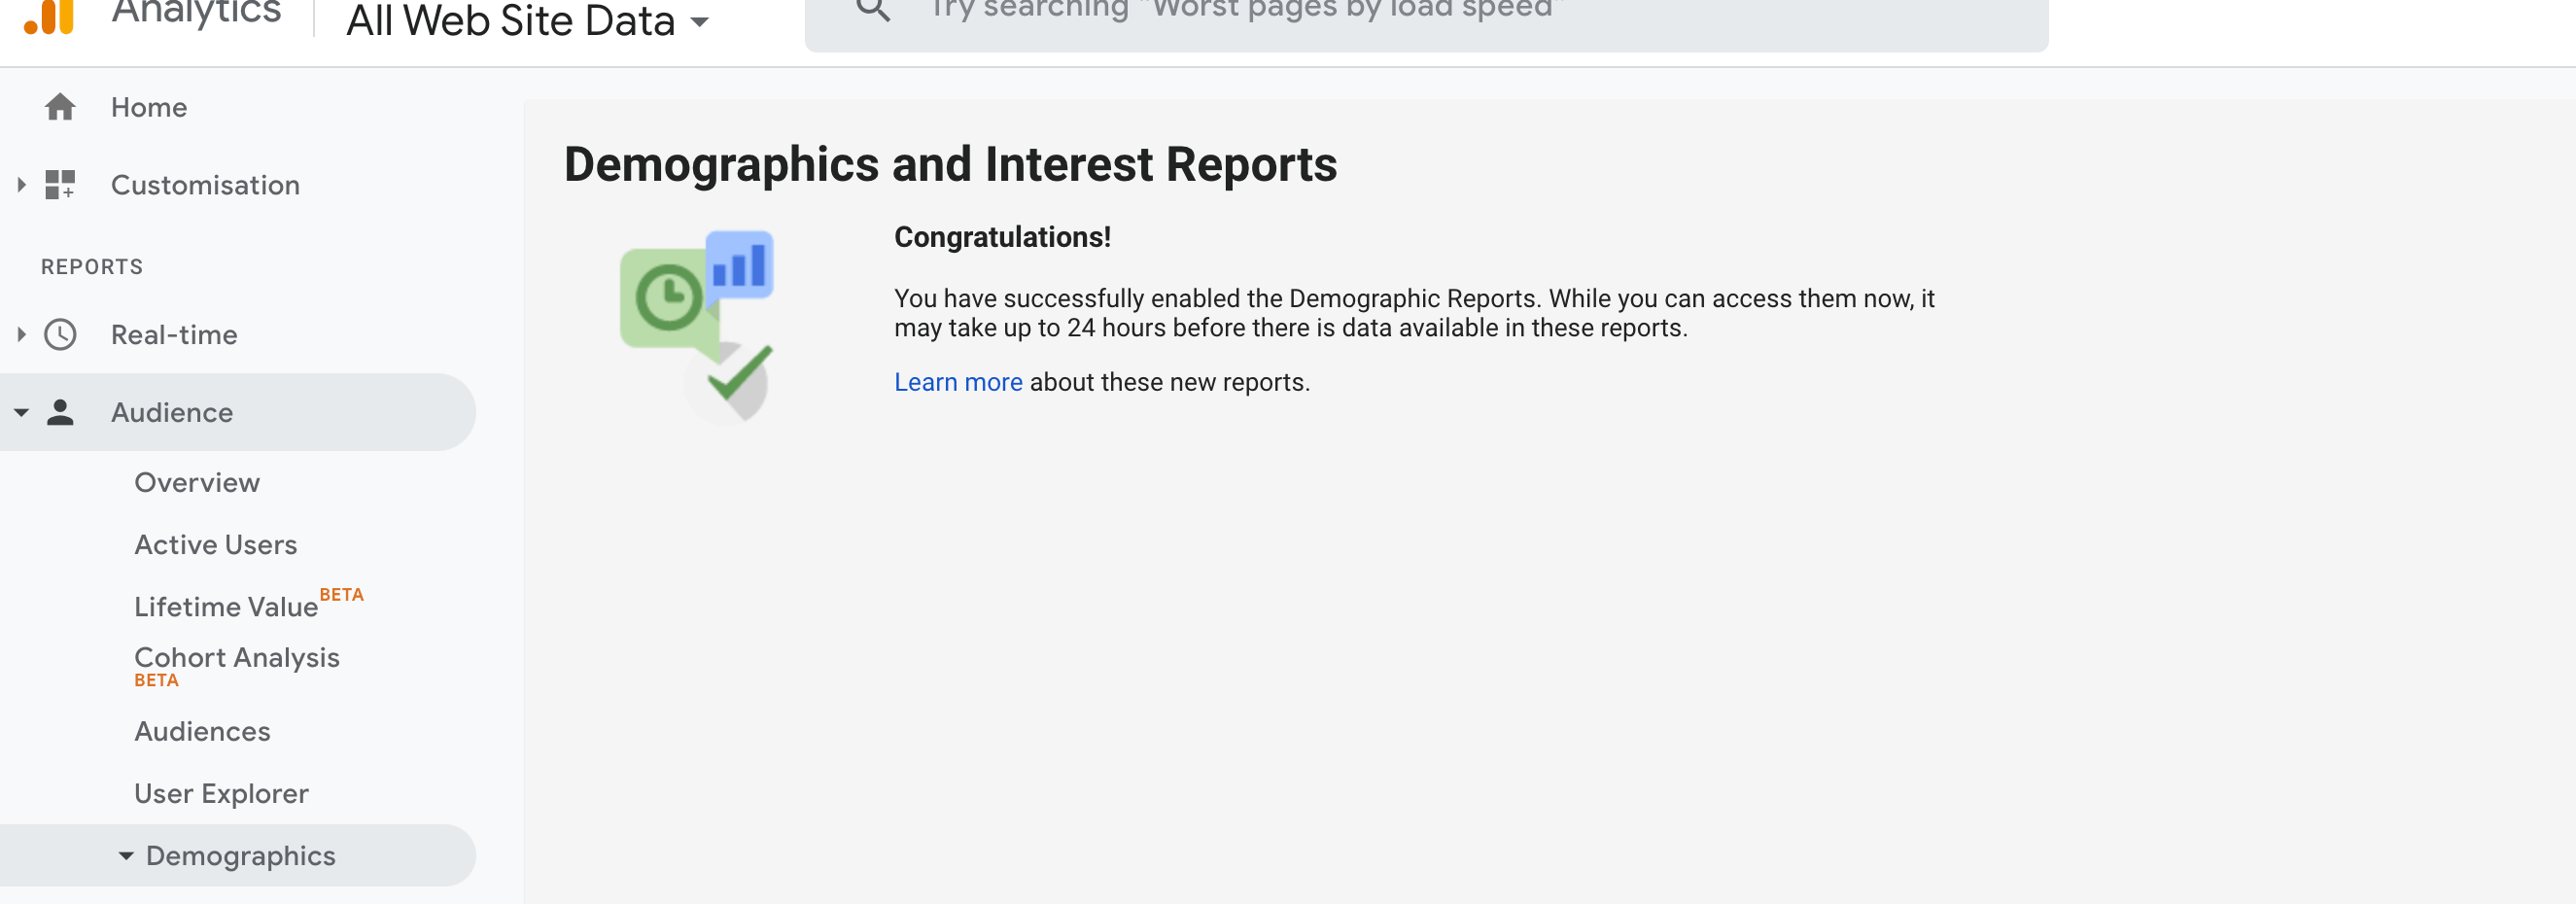
You should then receive a Congratulations message. Your data may take up to 24 hours to populate:
So get curious around who is visiting your site and most importantly who is spending money with you! Then, go find more of those people.

Megan Winter
Megan is an inspiring, brilliant and fun digital marketer and has worked with some of the fastest-growing eCommerce brands in the world.
Megan loves helping purpose-driven online store owners to make more income and achieve more impact.

